3D Interactive Models
This page provides direct links to 3D interactive models created for various I-Maps projects.
Links to the associated project pages are included for more inforation about each project.
See the following instructions for manipulating the models.
MOUSE CONTROLS FOR INTERACTIVE MODELS
- Use the left mouse button to change the viewing angle
- Use the right mouse button to shift the model position
- Use the mouse wheel to zoom in and out
Please note these are large models that may initially take 10 to 30 seconds to load.
TOPOGRAPHIC MODELS
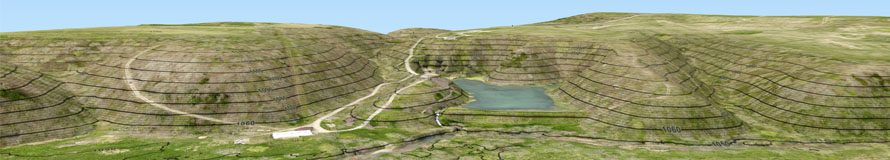
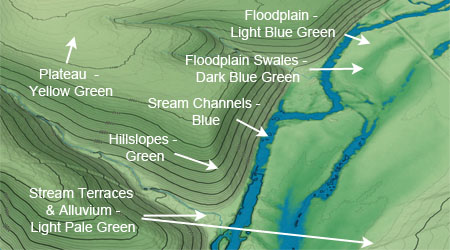
The following topographic models are based on 1-meter resolution digital elevation model (DEM) data derived from USGS aerial LIDAR surveys. Topographic contours are displayed at 2-foot intervals with index contours labeled at 20-foot intervals. Color topographic models are created by converting the DEMs to relative elevation models (REMs) where the elevation values represent the relative height of the land above the major stream channels along their length. The relative elevation models are colored in specific intervals of height above the streams to emphasize landscape features such as flood channels, stream terraces, hillsides, and plateaus as shown below.
Relative Elevation Model - Topographic Color Scheme
Rockspan Farm
The Rockspan Farm is a family farm located 11 miles west of Springfield, MO. I-Maps is currently helping the family develop a GIS field mapping application for farm managenet and planning. The project includes the development 3D models using USGS LIDAR data and 3D point cloud data we developed with drone photogrammetry. Project page: Rockspan Farm
Rockspan Farm 3D Topo Model (0.5 meter REM with 2-foot contours colored to highlight landscape geomorphology)
Rockspan Farm Aerial Enhanced 3D Topo Model (Spring 2020 aerial photography over 0.5-meter REM with 2-foot contours)
Rockspan Farm Spring 2020 3D Aerial Photo Model (aerial photography over 0.5-meter DEM)
Rockspan Farm Spring 2020 3D Aerial Topo Model (aerial photography over 0.5-meter DEM with 2-foot contours)
Rockspan Farm Winter 2022 3D Aerial Photo Model (aerial photography over 0.5-meter DEM)
Rockspan Farm Winter 2022 3D Aerial Topo Model (aerial photography over 0.5-meter DEM with 2-foot contours)
Rockspan Farm Tree Canopy Height On 3D Aerial Topo Model
(Winter 2022 aerial photography colored by tree canopy height over 0.5-meter DEM with 2-foot contours)
Rockspan Farm 3D Tree Canopy Surface Model
(Winter 2022 aerial photography colored by tree canopy height over 1-meter tree canopy surface model)
Nature Conservancy Site at Shoal & Hickory Creeks Confluence
TNC Site Topo ModelTNC Site Color Topo Model
Shoal & Clear Creeks Confluence
Shoal-Clear Creek Confluence Color Topo ModelValley Water Mill
Valley Water Mill Tree Canopy Height ModelOther Models
Albuquerque Subdivision 3D Topo ModelPeoria Downtown 3D Topo Model
Camp Wakonda Animated 3D Geomorphology-Photo Model
Ozark Downtown 3D Topo Model
Stonebridge Parcel 018 3D Topo Model
Wilson's Creek Battlefield 3D Aerial Topo Model
Land Application Site BR6-1,2,3
Synagro Site BR6-1,2,3 REM
Tampa Storm Surge
Busiek Topo Model
Busiek Geology Model
Other Maps & Models
Buffalo River Models
Buffalo River Big Bluff Area Canopy Height ModelBuffalo River Big Bluff Area Canopy Height Topo Model
Boston Mountains 2024 Fall Setellite Image Models
Mount Sherman Sentinal-2 Fall Color Image ModelGEOLOGIC MODELS
Ponca Wilderness Arkansas Geology Model
Ponca Wilderness Geology Model
Middle Shoal Creek Missouri Geologic Model
The following geologic models extend over the Middle Shoal Creek watershed in Southwest Missouri.
Middle Shoal Creek Geologic Lineaments Model
The lineament model is based on linear trends observed on 10-meter resolution DEM data.
The lineaments are shown as black lines and faults are shown as red lines.
The model may be rotated to view the alignment of stream channels and watershed boundaries that are aligned with the northwest structural trend of the area and northeast trend of the faults.
Middle Shoal Creek Northview Shale Structure Model
The Northview Shale structure model shows the variation in the elevation of the Northview Shale based on water well data.
The model includes a semi-transparent overlay of the Middle Shoal Creek topographic model for orientation.
The model includes red fault and lineament lines to show the trends in the geologic structure of the area.
The slice through the northwest part of the model is the down-dropped Sececa Fault Graben and the high red-colored areas are along the Joplin Anticline and the Ritchey Fault.
Contact Mark Phillips at 417-234-1326 for more information about I-Map Data Systems.